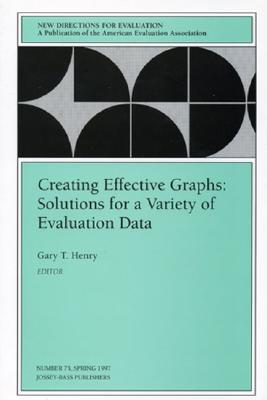
Creating Effective Graphs: Solutions for a Variety of Evaluation Data: New Directions for Evaluation, Number 73
$26.10
Description
Graphs are commonly used to present evaluation data. Their popularity for this and other uses stems from their ability to communicate information simply and efficiently. Graphs are powerful tools for evaluators, who must compete for their audience’s time. The audience can quickly retrieve information from a graph, without technical training or a particular talent with numbers. Unfortunately, getting a graph to function in this way is sometimes an adventure. Combining data, software, and hardware to make a graph is often a tedious task. This volume is an attempt to share ideas and improve the hit-or-miss nature of graphical production. The graphs in this volume are solutions to problems that arise when communicating evaluation findings. The problems are common and recurring. Sometimes they involve communicationg a known finding that could be contained in a table but would be much more difficult to extract from the table. Sometimes they expose biases in the narrative reporting of the data. Sometimes they reveal implications that would have gone unnoticed and allow new findings to emerge. The graphs can be used for discovery or for presentation; they are sometimes designed for evaluators and other times for evaluation audiences. This is the 73rd issue in the journal series New Directions for Evaluation
Editor: Henry, Gary T
Topic: Psychology
Media: Book
ISBN: 787998214
Language: English
Pages: 109
Additional information
| Weight | 0.25 lbs |
|---|---|
| Dimensions | 27.99 × 12.99 × 2.99 in |


Reviews
There are no reviews yet.